1
2
3
4
5
6
7
8
9
10
11
12
13
14
15
16
17
18
19
20
21
22
23
24
25
26
27
28
29
30
31
32
33
34
35
36
37
38
39
40
41
42
43
44
45
46
47
48
49
50
51
52
53
54
55
|
import numpy as np
import matplotlib.pyplot as plt
from matplotlib.colors import ListedColormap
from sklearn import neighbors, datasets
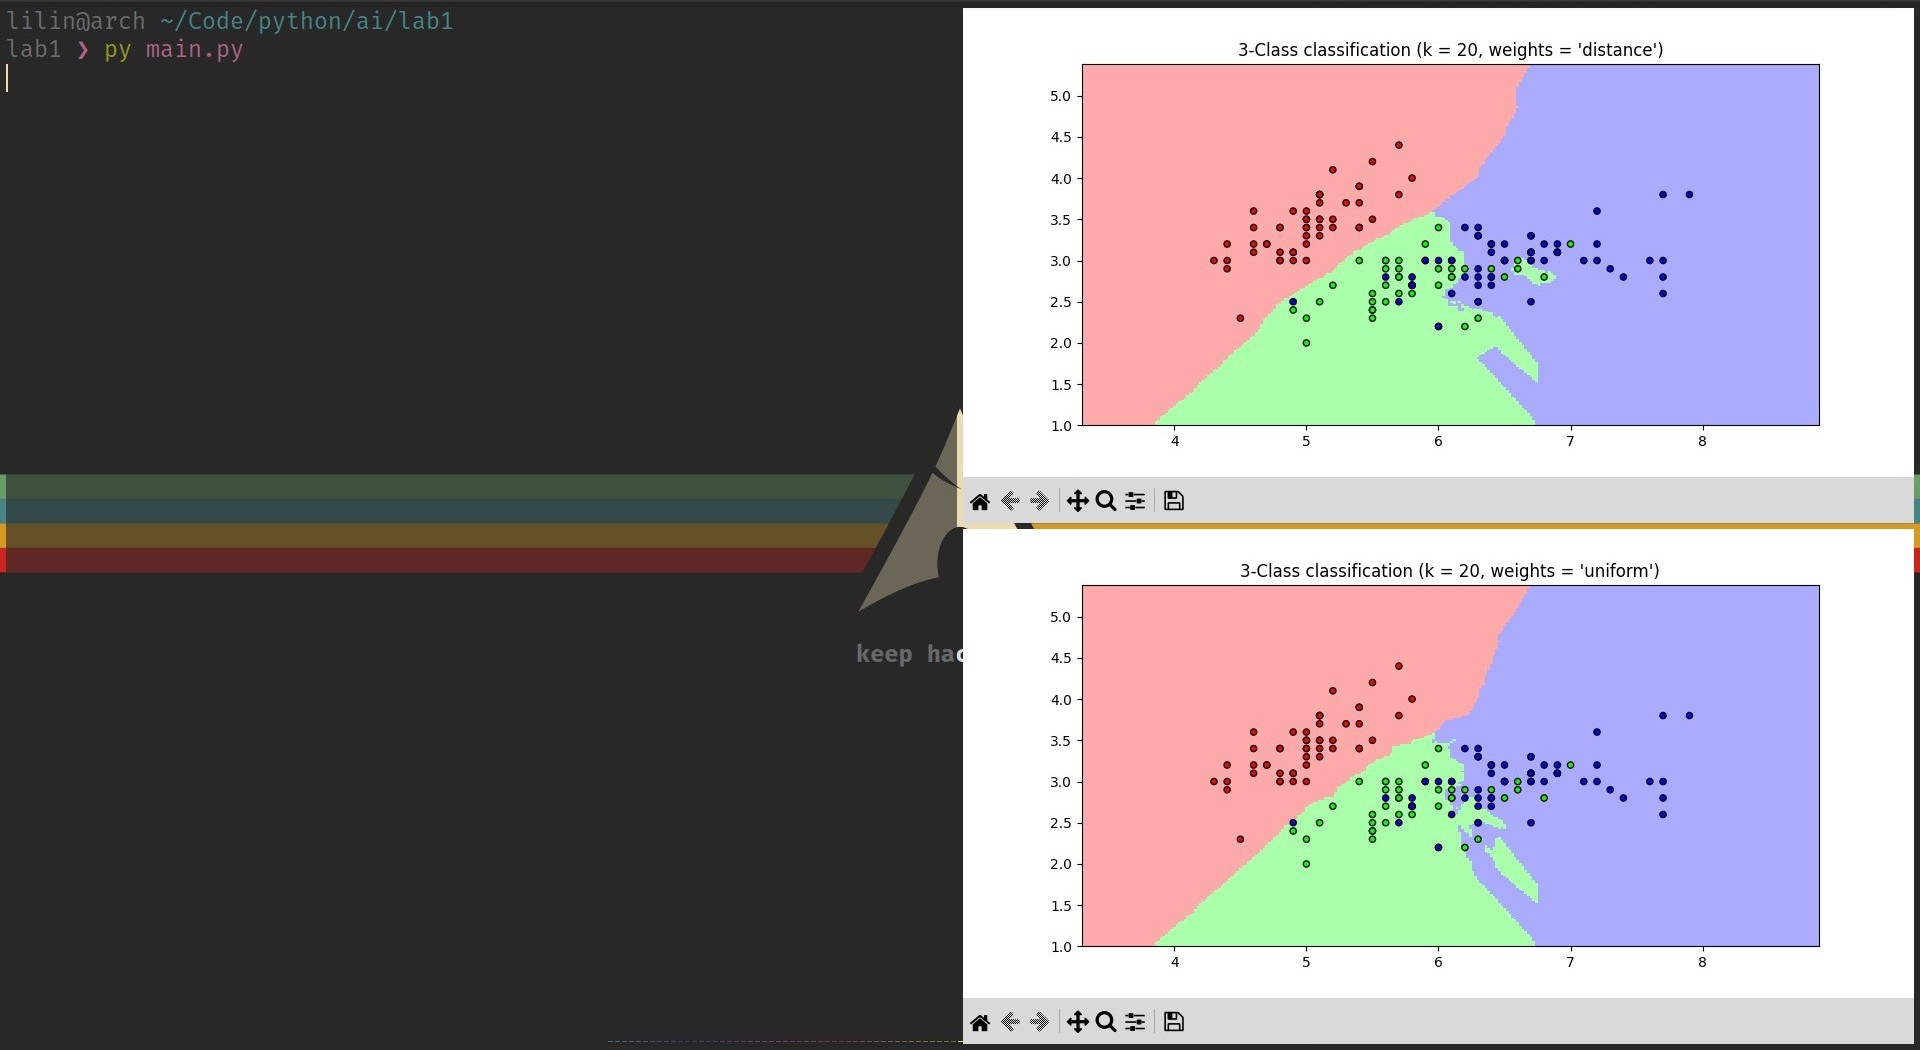
n_neighbors_22 = 15
iris_22 = datasets.load_iris()
X_22 = iris_22.data[:, :2]
y_22 = iris_22.target
h_22 = .02
cmap_light = ListedColormap(['#FFAAAA', '#AAFFAA', '#AAAAFF'])
cmap_bold = ListedColormap(['#FF0000', '#00FF00', '#0000FF'])
for weights in ['uniform', 'distance']:
clf = neighbors.KNeighborsClassifier(n_neighbors_22, weights=weights)
clf.fit(X_22, y_22)
x_min, x_max = X_22[:, 0].min() - 1, X_22[:, 0].max() + 1
y_min, y_max = X_22[:, 1].min() - 1, X_22[:, 1].max() + 1
xx, yy = np.meshgrid(np.arange(x_min, x_max, h_22),
np.arange(y_min, y_max, h_22))
Z = clf.predict(np.c_[xx.ravel(), yy.ravel()])
Z = Z.reshape(xx.shape)
plt.figure()
plt.pcolormesh(xx, yy, Z, cmap=cmap_light)
plt.scatter(X_22[:, 0], X_22[:, 1], c=y_22, cmap=cmap_bold,
edgecolor='k', s=20)
plt.xlim(xx.min(), xx.max())
plt.ylim(yy.min(), yy.max())
plt.title("3-Class classification (k = %i, weights = '%s')"
% (n_neighbors_22, weights))
plt.show()
|

